Exploring MLRSNet A Game Changer in Remote Sensing
Authors
- Nizaanth Raja
- Disha Ghosh
Dataset
The dataset used in our experiments is MLRSNet
MLRSNet offers a diverse collection of high-resolution satellite images, providing different perspectives of the world. It consists of 109,161 remote sensing images, each annotated into one of 46 categories. The number of images per category ranges between 1,500 and 3,000. All images have a fixed size of 256×256 pixels, with pixel resolutions varying from approximately 10m to 0.1m. Each image is also tagged with multiple labels, selected from 60 predefined class labels, with each image having between 1 to 13 labels. The dataset is suitable for tasks such as multi-label image classification, multi-label image retrieval, and image segmentation.
The dataset structure includes:
- Images folder: Contains 109,161 high-resolution images organized into 46 categories.
- Labels folder: Each category is accompanied by a corresponding .csv file listing the labels.
Categories_names.xlsx: Sheet 1 lists the 46 category names, while Sheet 2 details the associated multi-labels for each category.
Model(s)
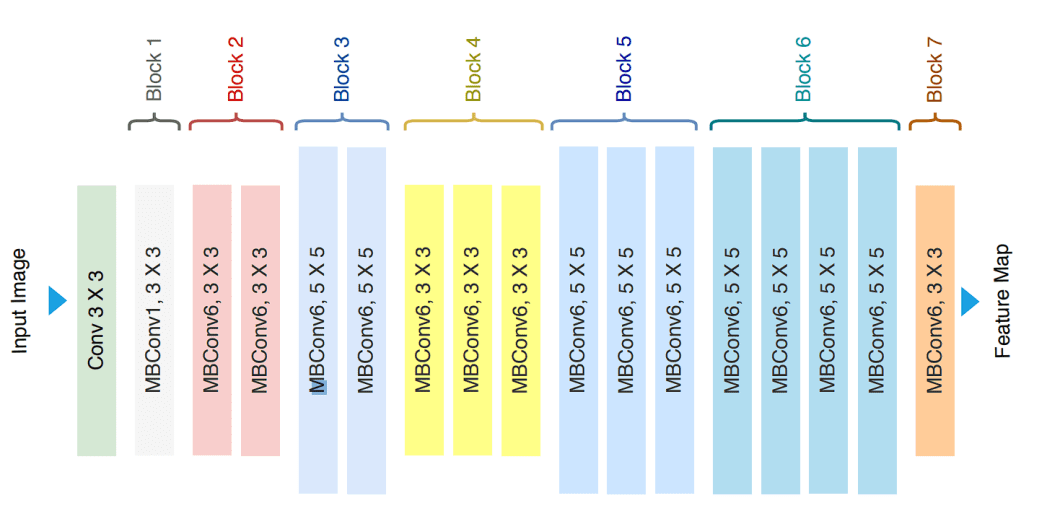
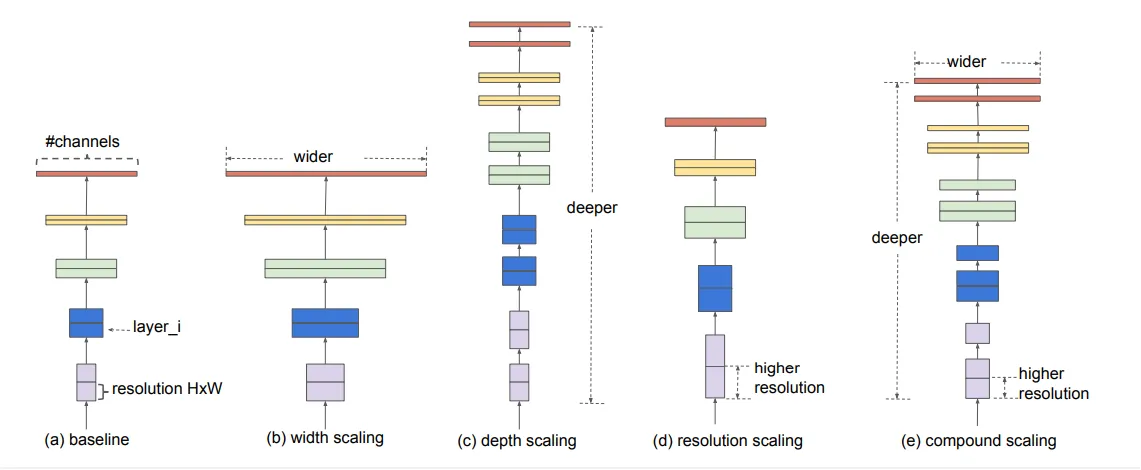
The model employed is EfficientNet B0 base model.
We compared the performance of the EfficientNet B0 model (pre-trained on ImageNet) with other models also using pre-trained weights, as referenced in the original paper. Additionally, we trained the two different EfficientNet B0 model from scratch with a different split ratio used in the original paper to further evaluate its performance; one where we used step decay and another where we implemented performance scheduling.
For more details on the, please refer the links below:


Results
We have the following results:
For the Fine - Tuning models
-
Results for Mean Average Precision (mAP)
Model 20% 30% 40% MLRSNet-InceptionV3 81.50 82.33 84.84 MLRSNet-VGGNet16 67.88 72.66 75.39 MLRSNet-VGGNet19 66.12 69.53 73.60 MLRSNet-ResNet50 82.65 84.28 86.01 MLRSNet-ResNet101 83.26 84.19 85.72 MLRSNet-DenseNet121 75.96 77.99 80.25 MLRSNet-DenseNet169 82.16 86.42 87.35 MLRSNet-DenseNet201 87.25 87.84 88.77 MLRSNet-EfficientNetB0 93.10 94.10 94.58 -
Results for F1 Score (Samples)
Model 20% 30% 40% MLRSNet-InceptionV3 0.7746 0.8016 0.8146 MLRSNet-VGGNet16 0.5743 0.6534 0.6855 MLRSNet-VGGNet19 0.5677 0.6120 0.6329 MLRSNet-ResNet50 0.7530 0.8176 0.8353 MLRSNet-ResNet101 0.7618 0.7703 0.8226 MLRSNet-DenseNet121 0.7154 0.7389 0.7571 MLRSNet-DenseNet169 0.8138 0.8408 0.8521 MLRSNet-DenseNet201 0.8381 0.8414 0.8538 MLRSNet-EfficientNetB0 0.8355 0.8492 0.8539
From the tables provided, it is evident that the EfficientNetB0 model outperforms the other architectures from the original paper in terms of both mean Average Precision (mAP) and F1 Score.
Table to summarize the performance metrics for the Scratch models incorporating Performance Scheduling and Step Decay.
| Metric | Performance Scheduling | Step Decay |
|---|---|---|
| F1 Score (Samples) | 0.8568 | 0.8395 |
| Binary Accuracy | 97.58% | 97.15% |
| ROC AUC Curve | 99.22% | 98.93% |
| Mean Average Precision | 94.61% | 93.53% |
| Hamming Loss | 2.41 | 2.84 |